Contents:

To ensure that your sample is not contaminated with either modern or other ancient samples, check the following:
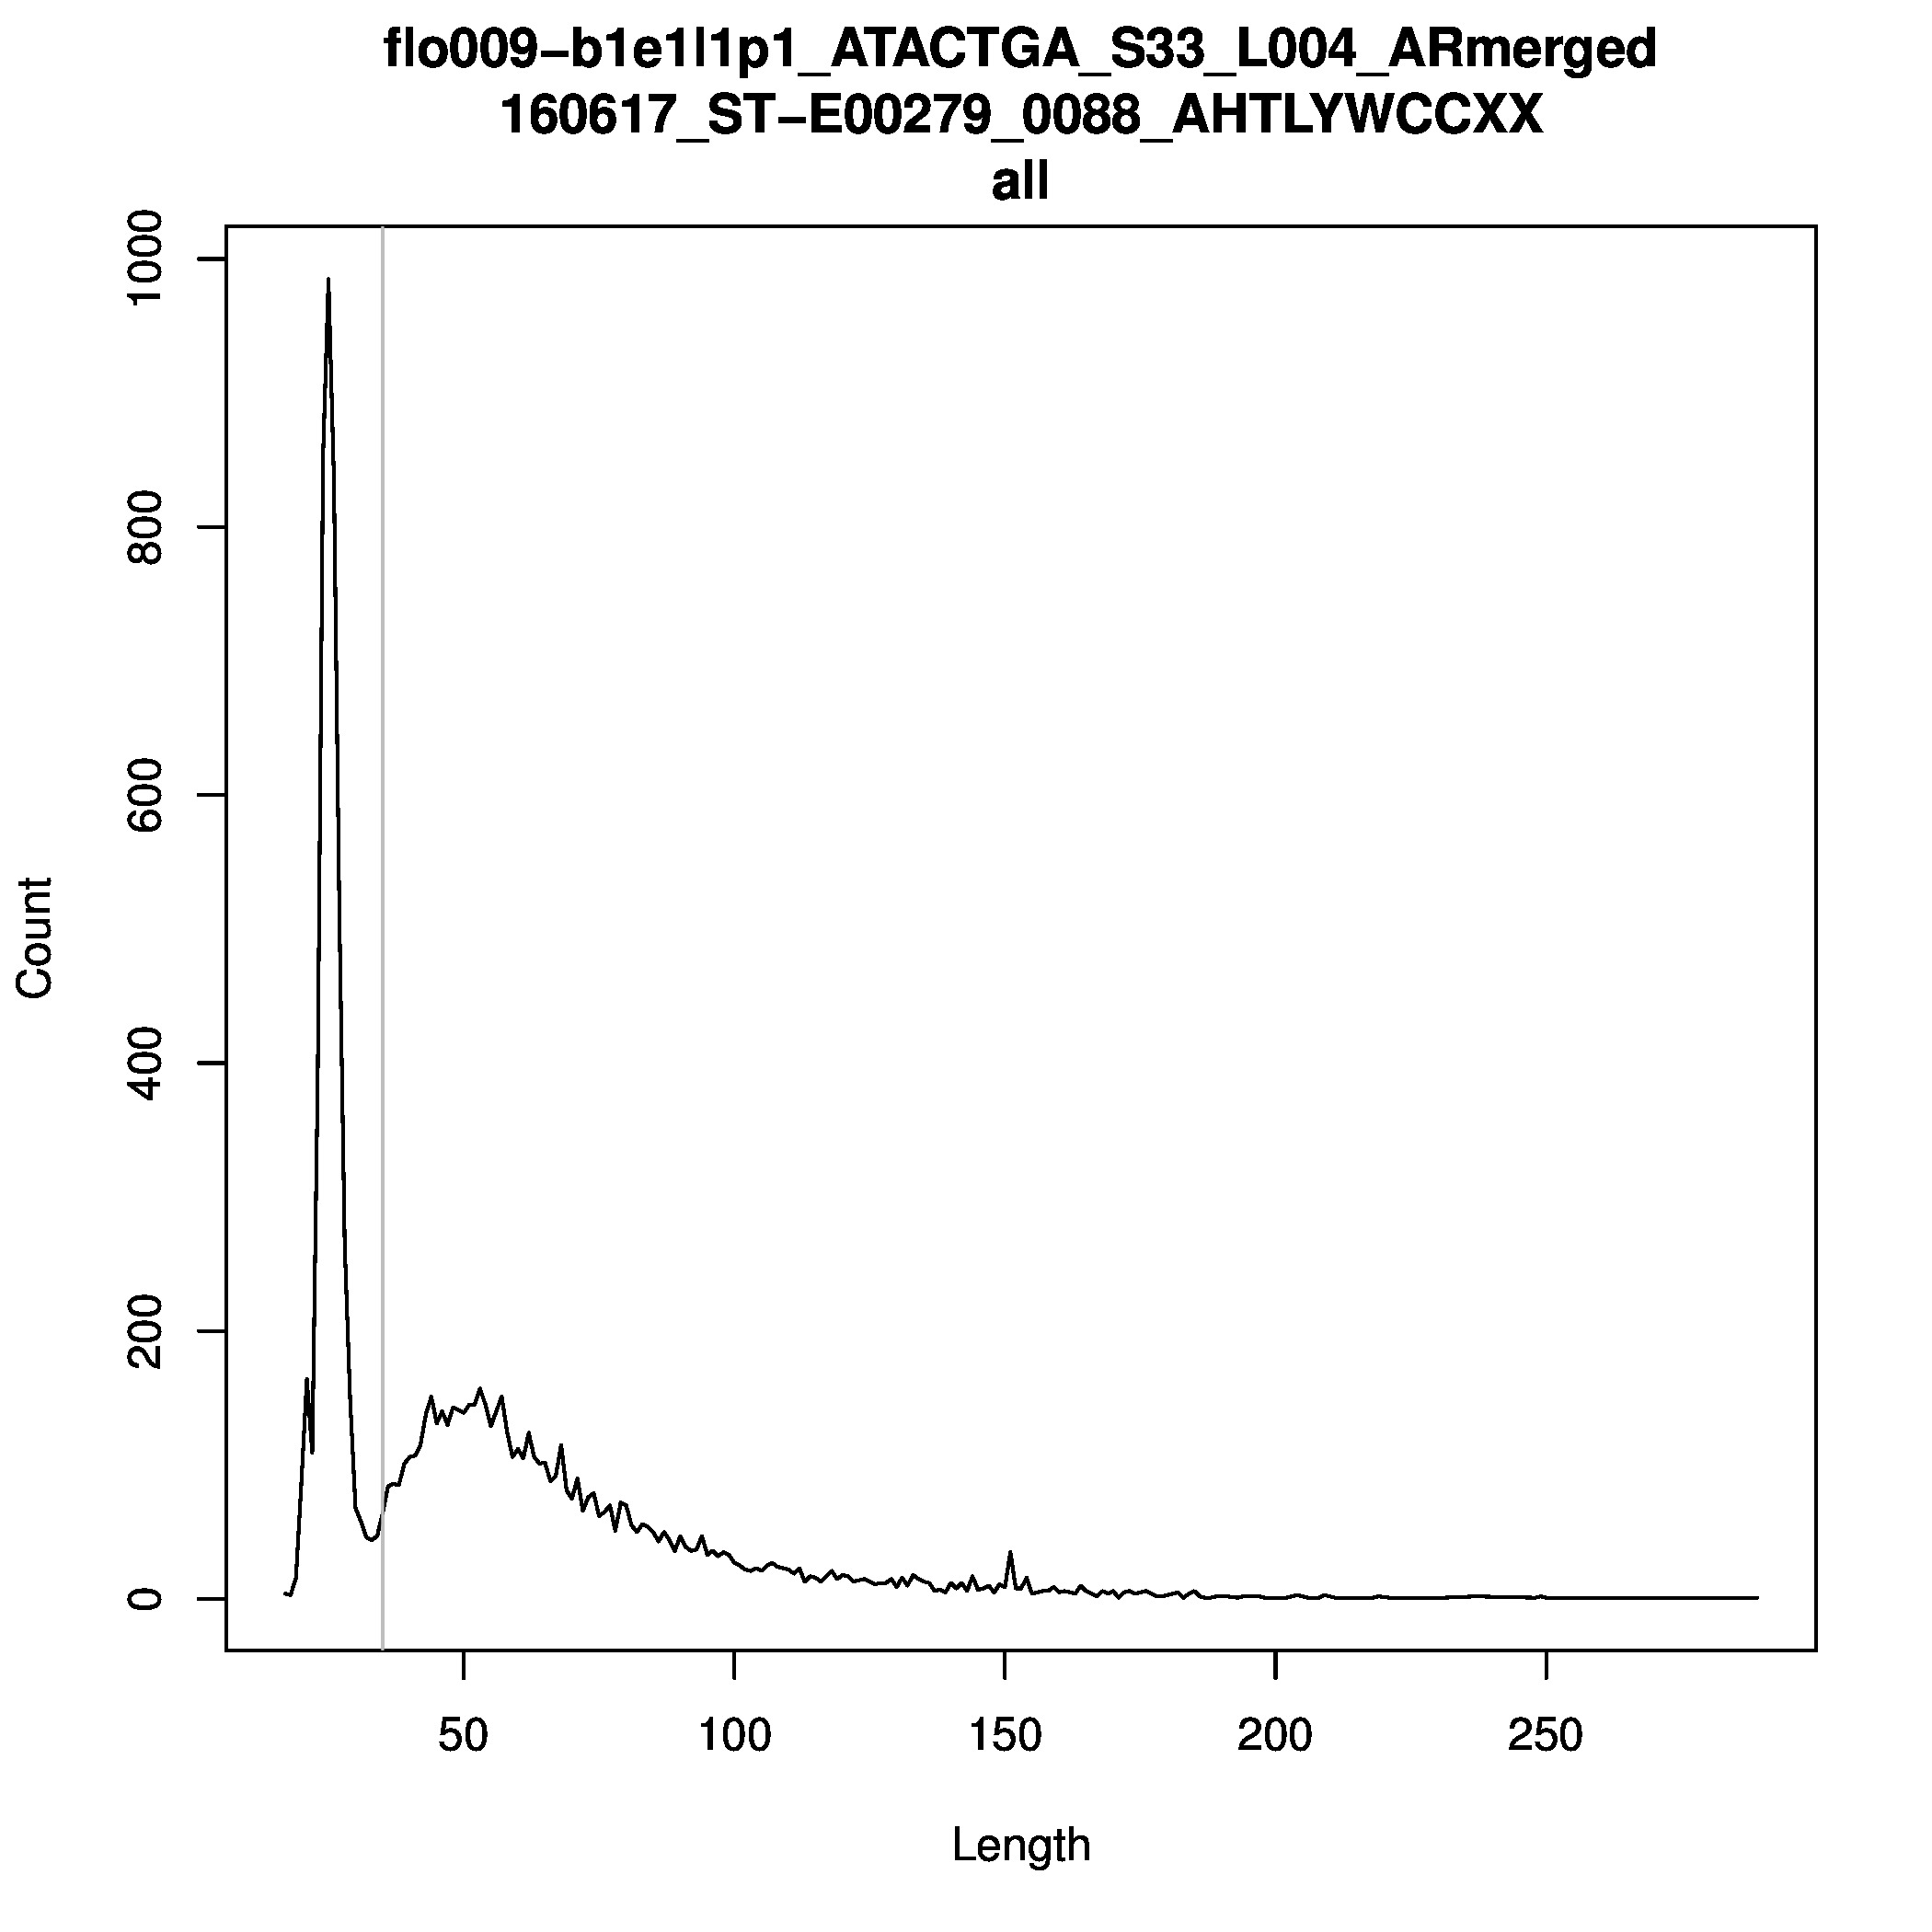
In general, if your samples´ averge read length (calculated on max 2M random reads) is longer than 100 bp, this can be an indication of modern contamination. The average read length does however depend on the individual sample’s degradation, but exceeding 100 bp should raise a red flag.
In the folder /proj/snic2020-2-10/private/Data/Human/Ancient/nobackup/RL_plots/ you can find read length plots of all sample libraries proccessed. These plots
include short reads, and reads with less than 90 % consensus with the reference, but excludes PCR duplicates. The plots gives an indication of the distribution,
which can be used to evaluate where the bulk of sequneces fall.
You can generate your own read length plots with the following code:
module load bioinfo-tools samtools/1.5
s_parameter=$(samtools view -q 30 -c $BAMFILE \
        |awk '{if ($0 <= 2000000)print $0;else print 2000000/$0}')
samtools view -q 30 -s ${s_parameter} $BAMFILE | awk '{print length($10)}' \
        |sort | uniq -c | sed 's/ \+/\t/g' | cut -f 2,3 > $(basename $BAMFILE).length
readlength_plot.R $OUTDIR $(basename $BAMFILE).length
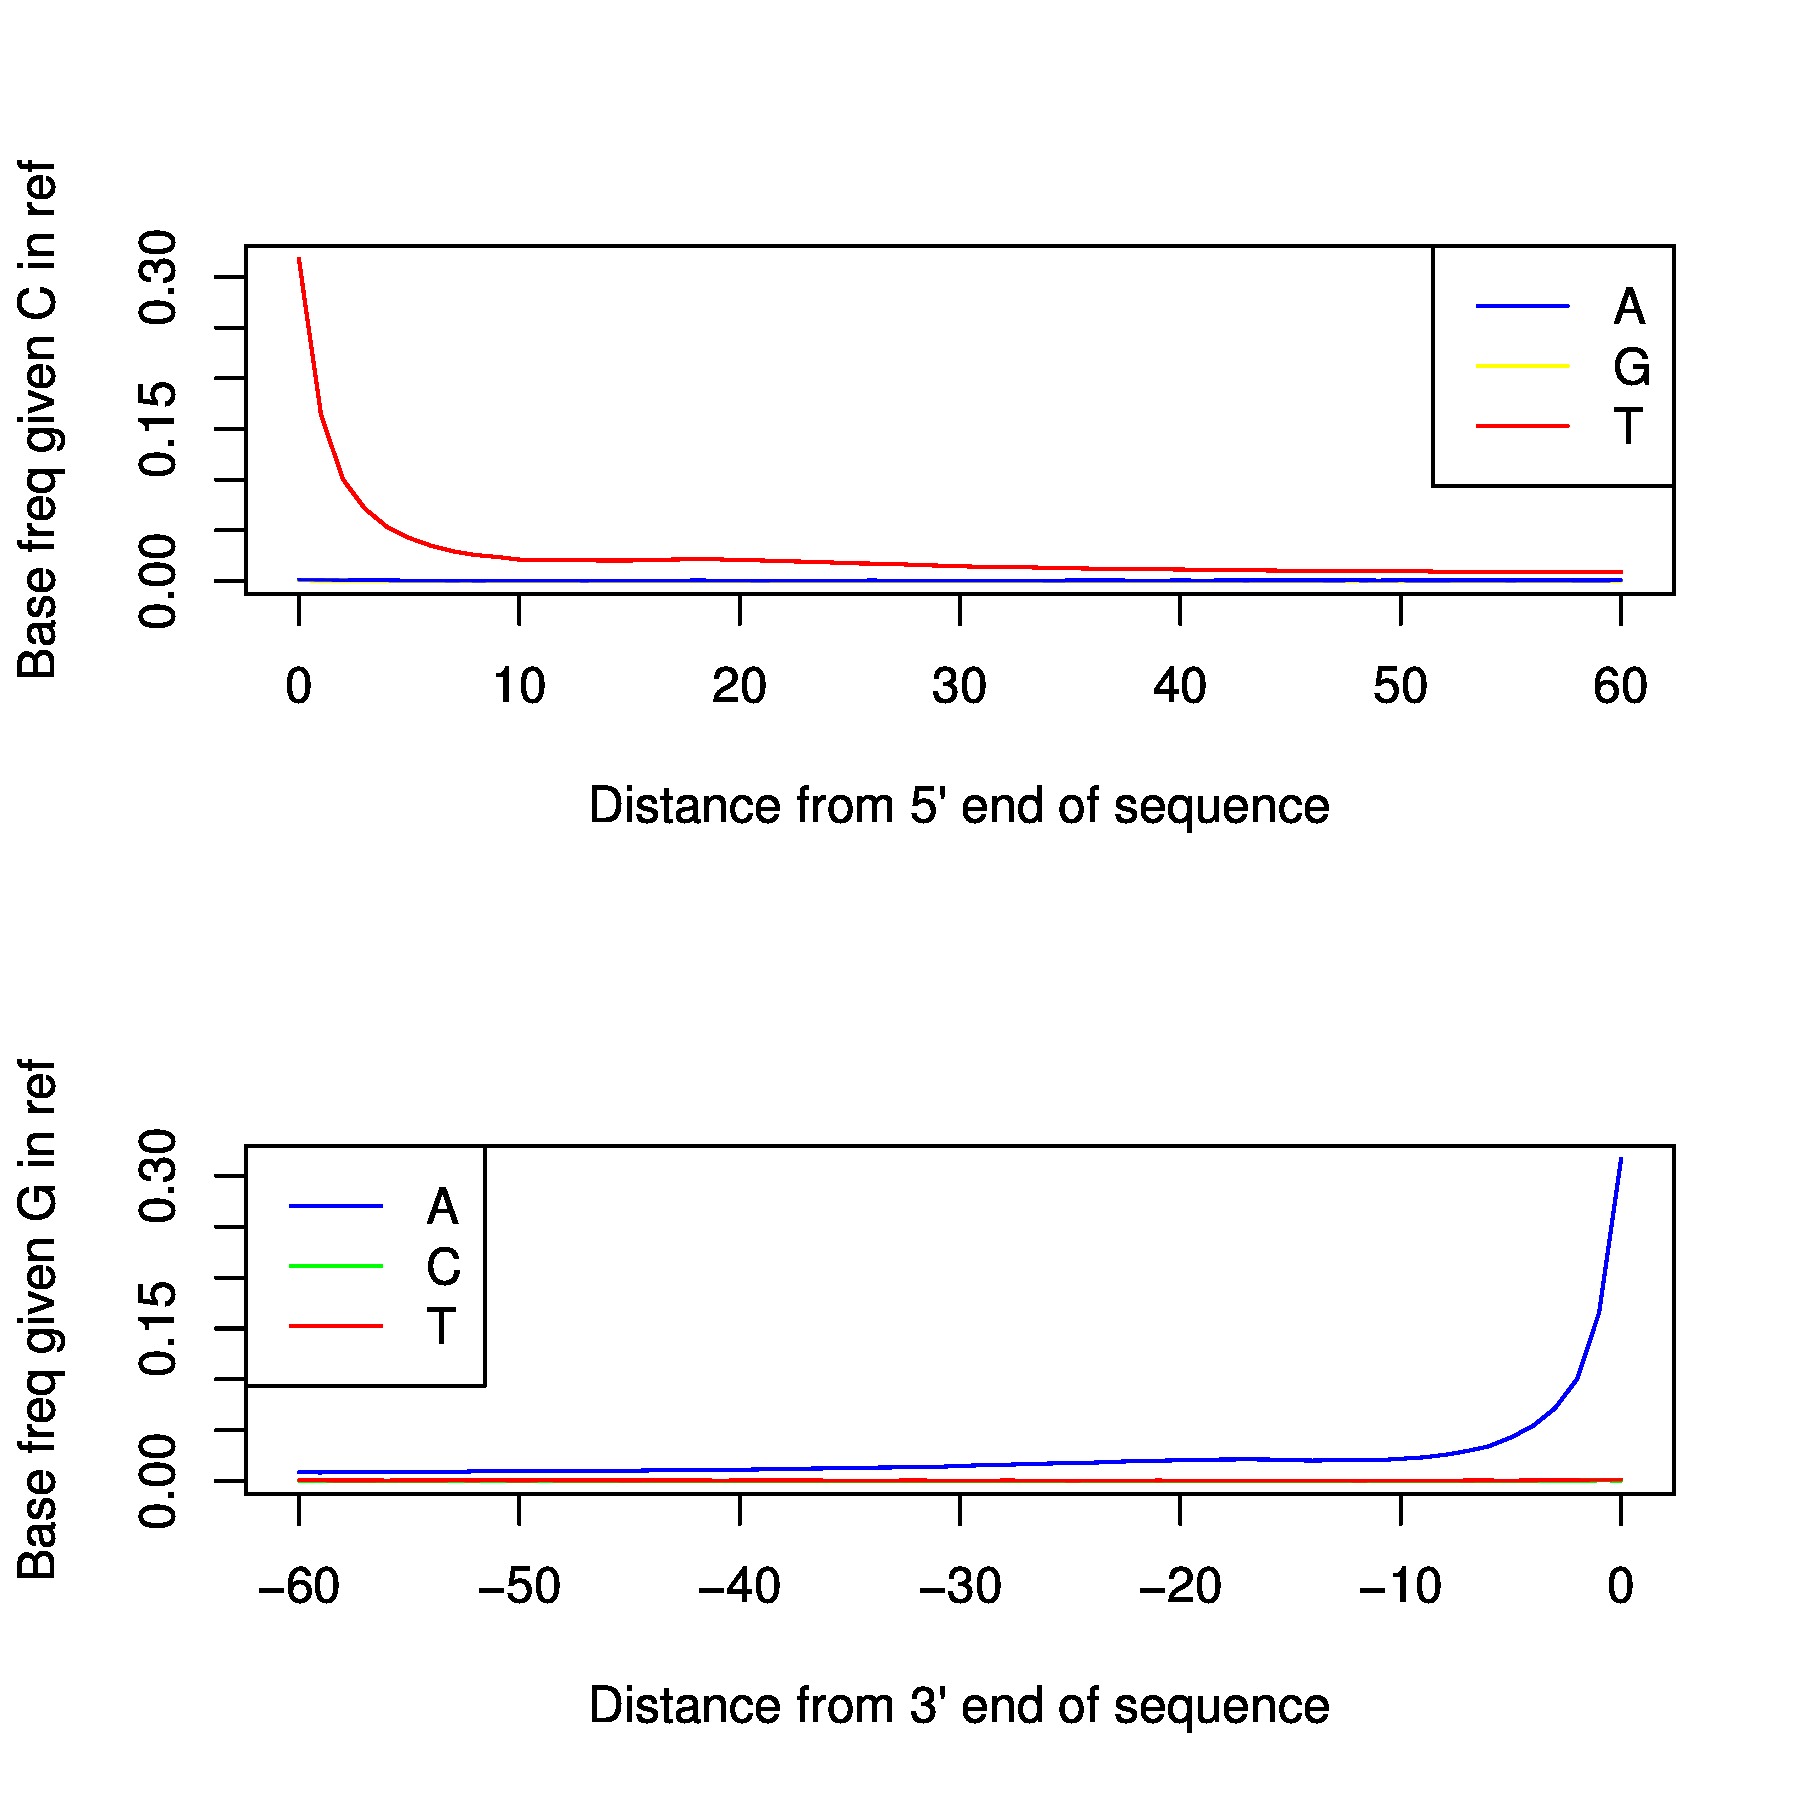
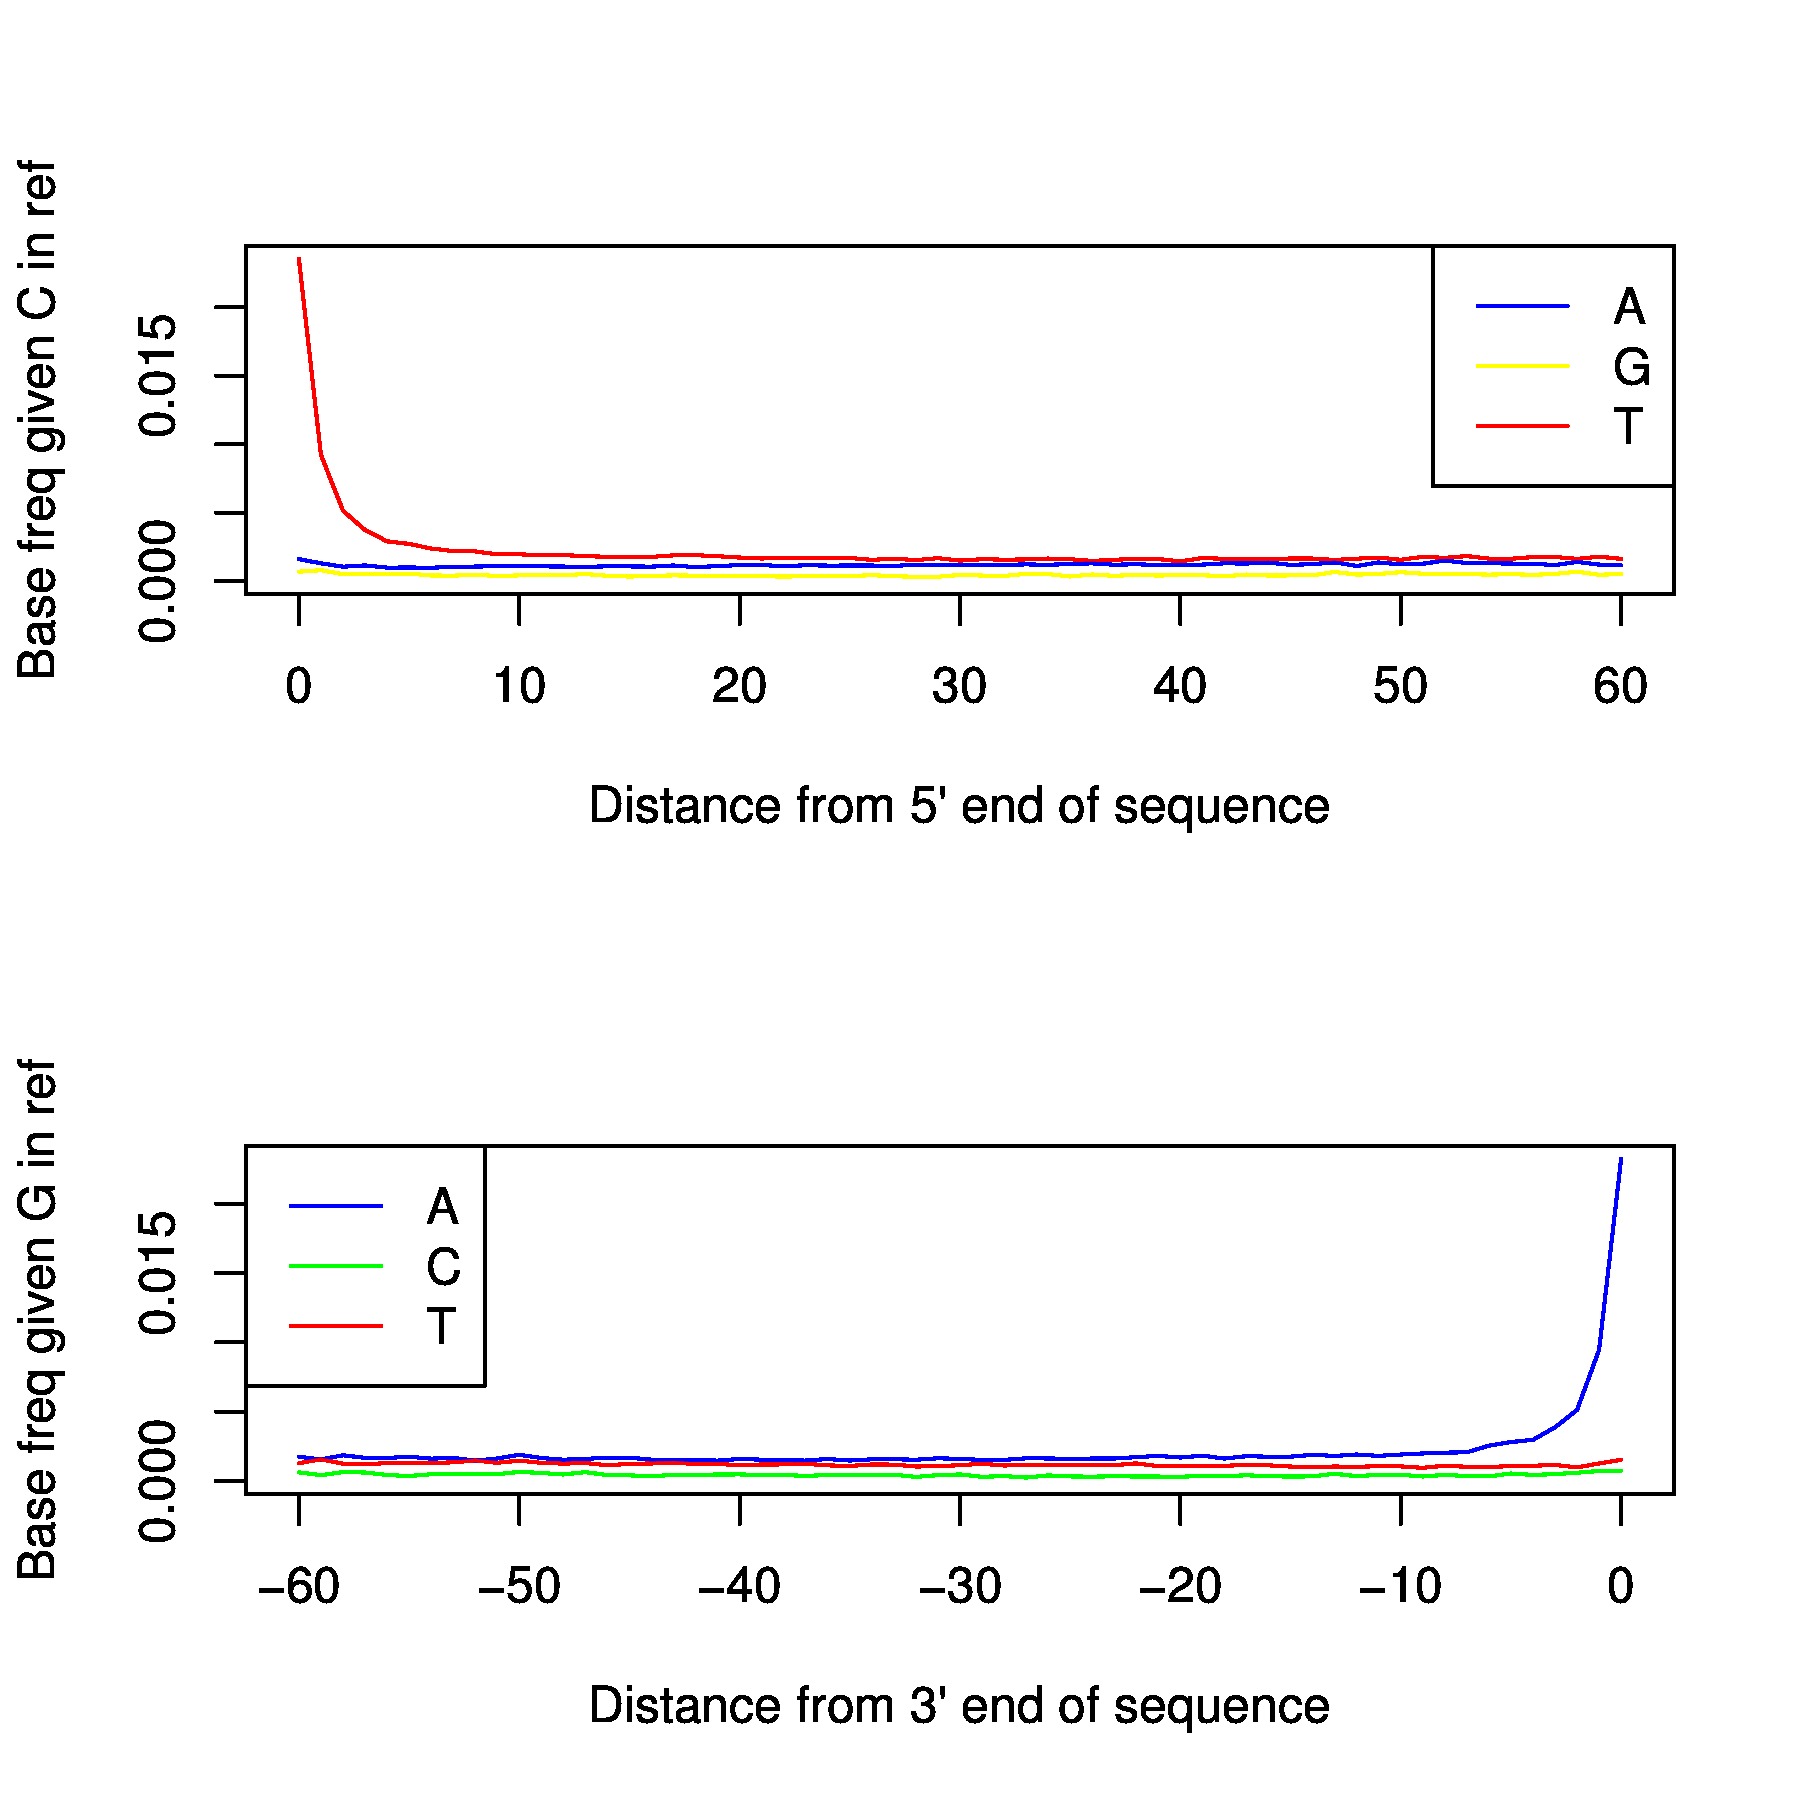
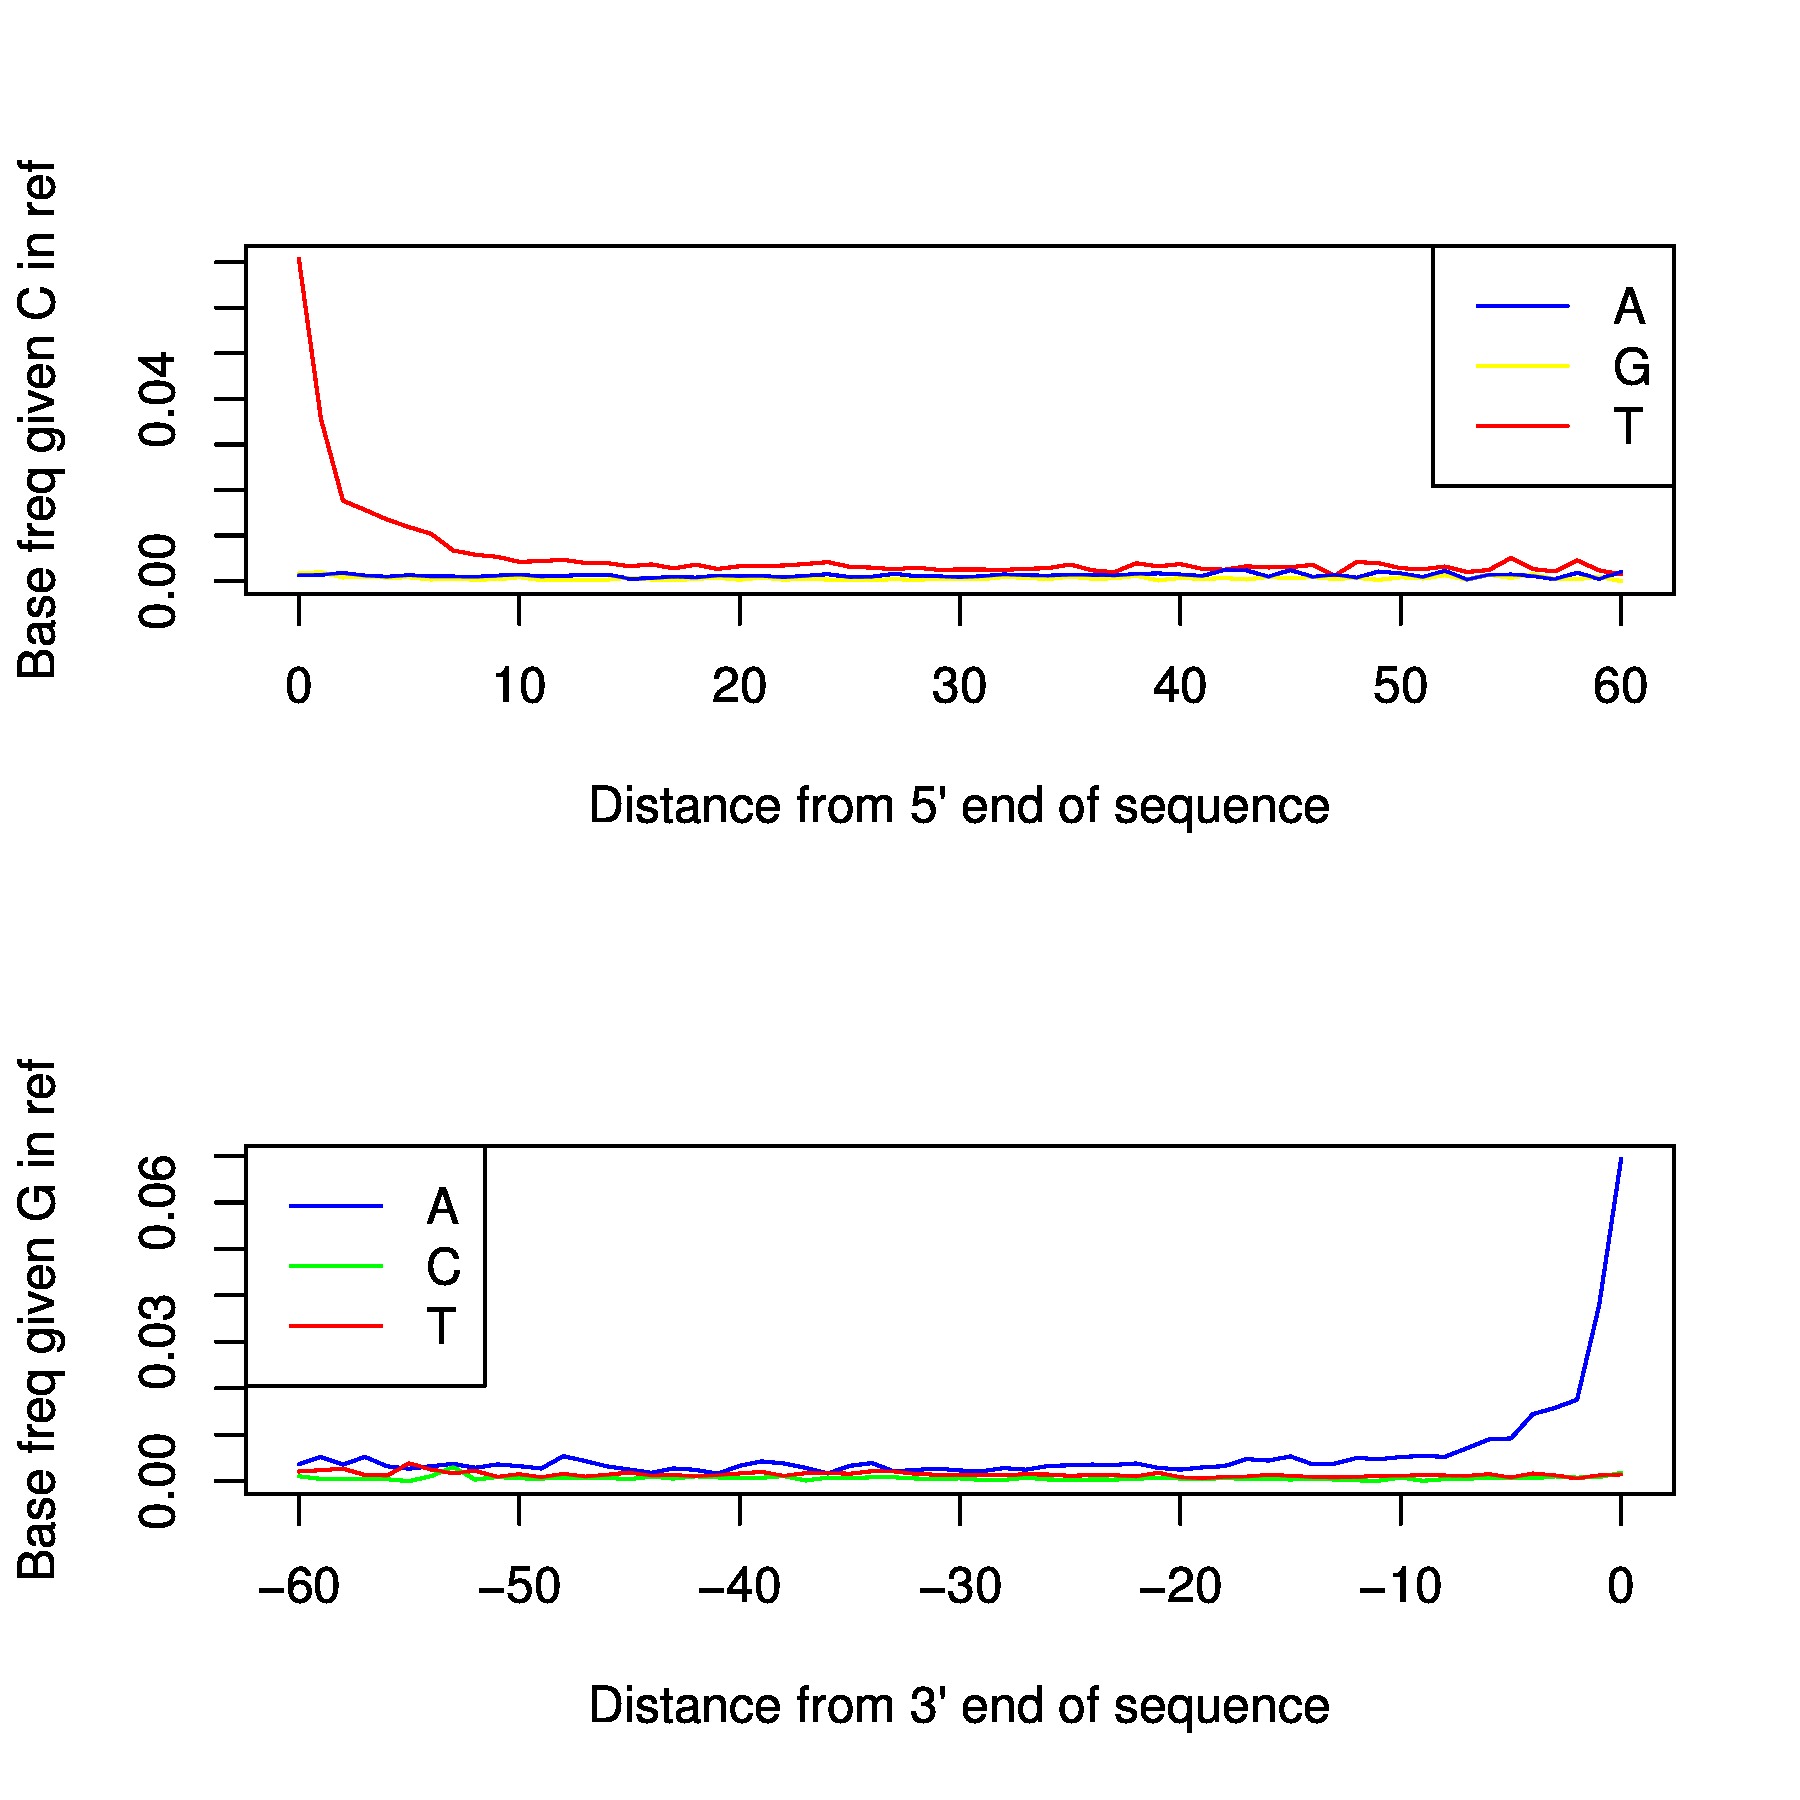
In the folder /proj/snic2020-2-10/private/Data/Human/Ancient/nobackup/damage_plots you can find damage plots for all samples. This plots the transitions at the end of each read. If your sample is ancient
you should be able to see a signal at both ends.
Depending on degradation level of the sample, the magnitude varies. Generally, for non-damage repaired libraries it will be >0.1, and damage repaired libraries usually end up around 0.08. If you have a library with low magnitude despite not being damage repaired, either you have an exceptional sample or it might have issues with modern contamination. Low coverage will of course also affect the result. You preferably want your plot to be like a smooth ski-slope. If you have low coverage this is harder to achive, but a contaminated sample might generate the same uneven result.
You can produce your own damage plots using the following code:
module load bioinfo-tools samtools/1.5
s_parameter=$(samtools view -q 30 -c $BAMFILE \
        | awk '{if ($0 <= 2000000)print $0;else print 2000000/$0}')
samtools view -q 30 -s ${s_parameter} $BAMFILE \
       | misincorp.py > $TMPDIR/${BAMFILE}.mismatch.tab
plot_misincorp.R $TMPDIR/${BAMFILE}
cp $TMPDIR/*.pdf $PWD
There are two different mitochondria contamination estimations: ContamMix by Fu et al. 2014 [1] and the Green et al. 2009 [2].
Estimate contamination based on contradicting signals in the mitochondrial data. Contamination estimates are obtained by identifying private or near-private (<5% in 311 modern mtDNAs) consensus alleles in each ancient individual, restricted to positions where coverage is at least 10 and base quality is 30. See [2] for details.
For low coverage the login node is usually enough, but for very high coverge run it on an interactive node.
Output: point estimate, informative sites, consensus alleles, total alleles, lower end CI, upper end CI, [positions of snps]
module load bioinfo-tools samtools/1.5
samtools mpileup -q 30 -Q 30 -r MT -f /proj/snic2020-2-10/private/Data/Human/Ancient/ref_seqs/$REFGENOME $BAMFILE\
          | mt_contamination.py <REF version (hg18 or hg19)>
A more advanced likelihood-based method to estimate contamination [1]. The consensus sequence is aligned with the 311 reference mt genomes mentioned above and then each read is tested agains all these 312 sequences. If reads map better to one of the other mts, they might be caused by contamination. This methods gives you the estimated authentic DNA (“clean” DNA) and not the contamination estimate like Green.
Before being able to run it you have to install the ContamMix package for R/3.4.0. You can do this using the command R CMD INSTALL /proj/snic2020-2-10/private/Data/Huamn/Ancient/bin/contamMix_1.0-10.tar.gz
Warning
Takes several hours, should be submitted with sbatch!! ~300x MT will take approximately 12 hours.
The result will be at the end of your slurm file.
mtcontamination_likelihood.sh <BAMFILE> <REFGENOME>
# orsbatch -A $proj -p core -n 1 -t 12:00:00 mtcontamination_likelihood.sh $BAMFILE /proj/snic2020-2-10/private/Data/Human/Ancient/ref_seqs/$REFGENOME
# will take 12h for ~300x MT
To estimate x-chromosome contamination for male samples, we use an ANGSD contamination estimation. To run it you need to create a bash file (ending with .sh) to submit on the cluster.
#!/bin/bash
module load bioinfo-tools ANGSD/0.921
BAMFILE=$1
angsd -i $BAMFILE -r X:5000000-154900000 -doCounts 1 -iCounts 1 -minMapQ 30 -minQ 30
Rscript /sw/apps/bioinfo/ANGSD/0.921/rackham/R/contamination.R mapFile="/sw/apps/bioinfo/ANGSD/0.921/src/angsd-0.921/RES/chrX.unique.gz" \
        hapFile="/sw/apps/bioinfo/ANGSD/0.921/src/angsd-0.921/RES/HapMapChrX.gz" countFile="angsdput.icnts.gz" mc.cores=20
Then submit it using:
sbatch -A $proj -p core -n 20 -t 3-0:00:00 -J Xchr-cont ${script}.sh $INBAM
Attention
Needs 20 (!) cores for 3 days, so it might take a while before it starts.
To check for autosomal contamination you can use VerifyBAMid. This method can detect
if your sample is a mixture of two samples, but as far as we know, it has not been extensivly tested on ancient or low coverage data. Running VerifyBAMid requires a reference
VCF file containing allele frequency information from potential contaminants. A file representing phase 3 of the 1000 genomes can be found at /proj/snic2020-2-10/private/Data/Human/Ancient/
Beware of that there are some indications that if you have too low coverage (<2-3x?) you will always get a contamintion estimation of 0. To run the script:
SNPref/ALL.wgs.phase3_shapeit2_mvncall_integrated_v5b.20130502.sites.vcf.gz
sbatch -A $proj -p core -n 2 -t 2-0:00:00 -J verifyBamID start_verifyBamID.sh ${INVCF} ${INBAM} ${OUTPREFIX}
This will produce several outfiles, the file ending with .selfSM will contain most of your results. Notice the column AVG_DP, and the FREEMIX column.
Bibliography
| [1] | Qiaomei Fu, Heng Li, Priya Moorjani, Flora Jay, Sergey M. Slepchenko, Aleksei A. Bondarev, Philip L. F. Johnson, Ayinuer Aximu-Petri, Kay Prüfer, Cesare de Filippo, Matthias Meyer, Nicolas Zwyns, Domingo C. Salazar-García, Yaroslav V. Kuzmin, Susan G. Keates, Pavel A. Kosintsev, Dmitry I. Razhev, Michael P. Richards, Nikolai V. Peristov, Michael Lachmann, Katerina Douka, Thomas F. G. Higham, Montgomery Slatkin, Jean-Jacques Hublin, David Reich, Janet Kelso, T. Bence Viola, and Svante Pääbo. Genome sequence of a 45,000-year-old modern human from western Siberia. Nature, 514(7523):445–449, October 2014. URL: https://www.nature.com/articles/nature13810, doi:10.1038/nature13810. |
| [2] | Richard E Green, Adrian W Briggs, Johannes Krause, Kay Prüfer, Hernán A Burbano, Michael Siebauer, Michael Lachmann, and Svante Pääbo. The Neandertal genome and ancient DNA authenticity. The EMBO Journal, 28(17):2494–2502, September 2009. URL: http://onlinelibrary.wiley.com/doi/10.1038/emboj.2009.222/abstract, doi:10.1038/emboj.2009.222. |